Fed Futures Probability
Read Post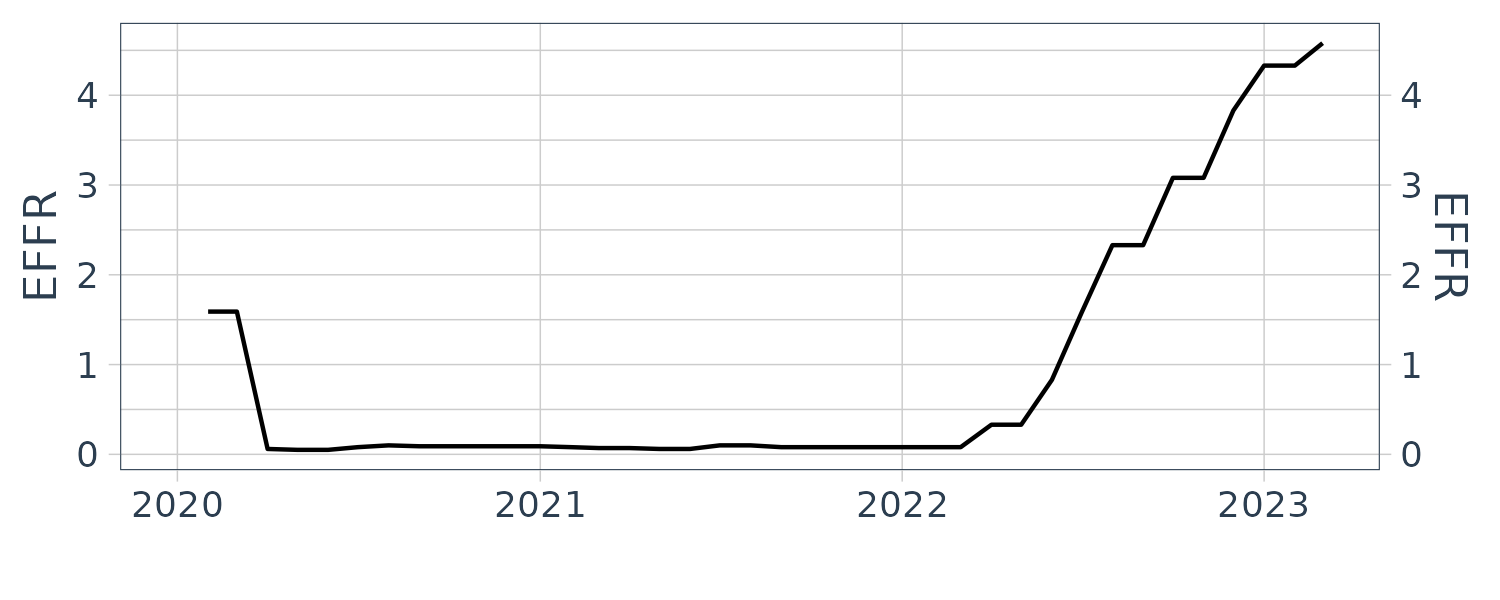
Contents:
It is possible to infer the probability of a rate hike/pause/cut by looking at 30-Day Fed Funds futures (ZQ). Refer to FedWatch tool to see up to date probabilities. In this post we will demonstrate how the probablities are calculated.
ZQ Futures
ZQ futures is a cash settled and the settlement price is the average daily Fed Funds ON rate for the delivery month (hence 30-Day) and the futures expire on the last business day of the contract month. The minimum tick is 0.5bps point and equivalent to a tick price of $20.835, and goes down to 0.25bps ($10.4175) on the delivery month.
The EFFR data can be found in FRED. It is the effective fed funds rate and is calculated based on the previous day weighted average transaction by brokers in the fed fund market for ON unsecured loans.
There are only 8 FOMC meetings in a year. So if there is no FOMC in the delivery month, then the futures price will be independent on what the decision is for the next FOMC’s meeting as the futures will be expired by then. Likewise, if the delivery month has a FOMC meeting and the next month has no FOMC, then the futures price of the next following month is only concerned with the outcome from this month’s FOMC meeting as the futures is still active prior and after the FOMC meeting.
Methodology
First of all we need to find an anchor month and work backward or forward from there to build up a probabilities for the outcome of each FOMC meeting. The anchor month \(T\) is the nearest full month without a FOMC meeting. Note the current month is never the anchor month. We can assume that for the anochor month \(T\):
\[\begin{aligned} \text{EFFR}(\text{End})_{T-1} &= \text{EFFR}(\text{Avg})_{T}\\ &= \text{EFFR}(\text{Start})_{T+1} \end{aligned}\]So for example if the anchor month is October 2022, and the futures price ZQV2 = 96.400. The implied EFFR rate would be:
\[\begin{aligned} \text{EFFR}(\text{End})_{\text{Sep}} &= \text{EFFR}(\text{Avg})_{\text{Oct}}\\ &= \text{EFFR}(\text{Start})_{Nov}\\ &= 100 - 96.9400\\ &= 3.0600 \end{aligned}\] \[\begin{aligned} N &= \text{Days in month before FOMC meeting}\\ M &= \text{days in month after FOMC meeting (including meeting date)} \end{aligned}\]For months with FOMC in the subsequent month:
\[\begin{aligned} \text{EFFR}(\text{Start})_{T} &= \frac{\text{EFFR}(\text{Avg})_{T} - \frac{M}{M + N} \text{EFFR}(\text{End})_{T}}{\frac{N}{M + N}} \end{aligned}\]For months with no FOMC in the subsequent month:
\[\begin{aligned} \text{EFFR}(\text{End})_{T} &= \frac{\text{EFFR}(\text{Avg})_{T} - \frac{N}{M + N} \text{EFFR}(\text{End})_{T}}{\frac{M}{M + N}} \end{aligned}\]For example, given Sep futures price:
\[\begin{aligned} \text{ZQU2 }P &= 97.4475\\ \text{Implied Rate}_{\text{Sep}} &= \text{EFFR}(\text{Avg}_{\text{Sep}})\\ &= 100 - 97.4475\\ &= 2.5525\\ N &= 20\\ M &= 10 \end{aligned}\] \[\begin{aligned} \text{EFFR}(\text{Start})_{\text{Sep}} &= \frac{2.5525 - \frac{10}{30}3.0600}{\frac{20}{30}}\\ &= 2.2987 \end{aligned}\]Therefore, the expected EFFR change during the for the month of Sep:
\[\begin{aligned} \text{EFFR}(\text{End})_{\text{Sep}} - \text{EFFR}(\text{Start})_{\text{Sep}} &= 3.0600 - 2.2987\\ &= 0.7613 \end{aligned}\]Taking account of the minimum tick of 25bps, the number of hikes:
\[\begin{aligned} \text{Num of Hikes} &= \frac{0.7613}{25 * 0.01}\\ &= 3.0452 \text{ Hikes} \end{aligned}\]The remaining decimal of 0.0452 can be used to calculate the probability of a 75bps hike:
\[\begin{aligned} P(\text{75 bps})_{\text{Sep}} &= 1 - 0.0452\\ &= \text{95.5\%} \\ P(\text{100 bps})_{\text{Sep}} &= 0.0452\\ &= \text{4.5\%}\\ P(\text{Others})_{\text{Sep}} &= 0 \end{aligned}\]Next, we work on the next month Nov which is a FOMC month:
\[\begin{aligned} \text{ZQX2 }P &= 96.4300\\ \text{Implied Rate}_{\text{Nov}} &= \text{EFFR}(\text{Avg})_{\text{Nov}}\\ &= 100 - 96.4300\\ &= 3.5700\\ N &= 1\\ M &= 29\\ \text{EFFR}(\text{End})_{\text{Nov}} &= \frac{3.06 - \frac{1}{30}3.5700}{\frac{29}{30}}\\ &= 3.5876\\ \text{EFFR}(\text{End})_{\text{Nov}} - \text{EFFR}(\text{Start})_{\text{\text{Nov}}} &= 3.5876 - 3.06\\ &= 0.5276\\[5pt] \text{Num of Hikes} &= \frac{0.5276}{25 * 0.01}\\ &= 2.1103 \text{ Hikes}\\[5pt] P(\text{50 bps})_{\text{Nov}} &= 1 - 0.1103\\ &= \text{89\%}\\ P(\text{75 bps})_{\text{Nov}} &= 0.1103\\ &= \text{11.03\%}\\ P(\text{Others})_{\text{Nov}} &= 0 \end{aligned}\]Finally, to combine the two probabilities to get the probability of a conditional probability (assuming independence):
\[\begin{aligned} P(\text{125 bps})_{\text{Nov}} &= P(\text{50 bps}_{\text{Nov}}|\text{75 bps}_{\text{Sep}})\\&= P(\text{50 bps}_{\text{Nov}}) * P(\text{75 bps}_{Sep})\\ &= 0.890 * 0.955\\ &= \text{85\%}\\[5pt] P(\text{150 bps})_{\text{Nov}} &= P(\text{75 bps}_{\text{Nov}}|\text{75 bps}_{\text{Sep}}) + P(\text{50 bps}_{\text{Nov}}|\text{100 bps}_{\text{Sep}})\\ &= P(\text{75 bps}_{\text{Nov}})P(\text{75 bps}_{\text{Sep}}) + P(\text{50 bps}_{\text{Nov}})P(\text{100 bps}_{\text{Sep}})\\ &= (0.110 * 0.955) + (0.890 * 0.045) \\ & = 0.105 + 0.040 \\ &= \text{14.5\%}\\[5pt] P(\text{175 bps})_{\text{Nov}} &= P(\text{75 bps}_{\text{Nov}}|\text{100 bps}_{\text{Sep}})\\ &= P(\text{75 bps}_{\text{Nov}})P(\text{100 bps}_{\text{Sep}})\\ &= 0.110 * 0.045\\ &= \text{0.5\%} \end{aligned}\]