Banking
Read Post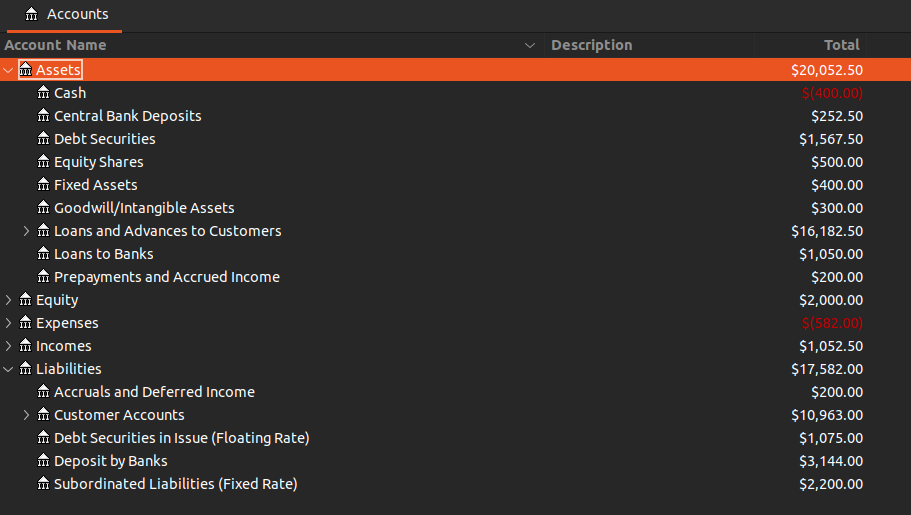
In this post we will follow the examples in Moorad Choudhry’s The Principles of Banking book.
Contents:
Introduction
A traditonal bank gets its funding by borrowed funds from customer deposits and provide loans to customers. The borrowed funds are short-term in nature and loans are much longer term. This is known as “maturity transformation”. The borrowed funds are a way for banks to leverage on its capital (shareholder’s equity).
If the bank created more loans than deposits, it can borrow from wholesale market or get from the shareholder’s equity. However many crises are due to banks overleveraging and encountering liquidity squeeze (unable to borrow) during a bank run and resulting in a bank failure.
The difference between interest received from loans, and interest paid on deposits is known as the Net Interest Income (NII).
Net Interest Income (NII)
Banks have 3 forms of income:
- Net Interest Income
- Fees
- Commissions
And the main funding sources:
- Customer Deposits
- Capital Markets (Senior Debt)
- Wholesale Markets (Inter-bank Money Market)
- Securitized Securities
- Bonds
Loan Valuation
The Return on Equity (ROE) is usually targetted in a bank strategy:
\[\begin{aligned} \text{ROE} &= \frac{\text{Interest Income} + \text{Fees} + \text{Comission}}{\text{Equity}} \end{aligned}\]The loan interest has to be set such that the ROE is higher than the target ROE.
\[\begin{aligned} \text{Equity} &= \frac{(1 - \text{Tax Rate}) \times (\text{Revenue on Loan} - \text{Funding Cost}) + (\text{Loan} - \text{Deposit})}{1 + \text{Target ROE}} \end{aligned}\] \[\begin{aligned} \text{Revenue Loan} &= \text{Loan Interest} \times \text{Deposit} \end{aligned}\]For example, given the following info:
\[\begin{aligned} \text{Asset} &= 100\\ \text{Deposit} &= 90\\ \text{Equity} &= 10\\ \text{Loan Maturity} &= \text{1Y}\\ \text{Deposit Rate} &= 5\%\\ \text{Target ROE} &= 10\%\\ \text{Corporate Tax Rate} &= 20\% \end{aligned}\]Putting it in the formula and solve for Loan Interest:
\[\begin{aligned} 10 &= \frac{(1 - 20\%) \times (\text{Loan Interest} \times 100 - 5\% \times 90) + (100 - 90)}{1.10} \end{aligned}\] \[\begin{aligned} \text{Loan Interest} &= 5.75\% \end{aligned}\]Therefore, the loan interest has to be set higher than 5.75%. The funding rate is 5% so:
\[\begin{aligned} \text{Break-Even Margin} &= \text{Loan Interest} - \text{Funding Rate}\\ &= 5.75\% - 5\%\\ &= 75\text{bps} \end{aligned}\]The Break-even margin is the required margin to create shareholder value.
If we incorporate default risk and change the maturity to 2Y:
\[\begin{aligned} \text{Loan Maturity} &= \text{2Y}\\ \text{Loan Default Probability Year 1} &= 0\%\\ \text{Loan Default Probability Year 2} &= 5\%\\ \text{Recovery Rate} &= 40\% \end{aligned}\] \[\begin{aligned} \text{Equity} = &\ \frac{(1 - \text{Tax Rate}) \times (\text{Revenue on Loan} - \text{Funding Cost})}{1 + \text{Target ROE}} +\\[5pt] &\ \text{(1 - Year 2 Default Prob)} \times \frac{(1 - \text{Tax Rate}) \times (\text{Revenue on Loan} - \text{Funding Cost}) + (\text{Loan} - \text{Deposit})}{(1 + \text{Target ROE})^{2}} +\\[5pt] &\ \text{(Year 2 Default Prob)} \times \frac{\text{Tax Recovery} - (1 - \text{Tax Rate}) \times \text{Funding Cost} + (\text{Recovery Amount} - \text{Deposit})}{(1 + \text{Target ROE}^{2}} \end{aligned}\]Substituting the values:
\[\begin{aligned} 10 = &\ \frac{0.8 \times (100 \times \text{Loan Interest} - 90 \times 0.05)}{1.10} +\\[5pt] &\ 0.95 \times \frac{0.8 \times \Big(100 \times \text{Loan Interest} - 90 \times 0.05\Big)) + (100 - 90)}{1.10^{2}} +\\[5pt] &\ 0.05 \times \frac{(0.60 \times 100) - 0.8 \times (90 \times 0.05) + (0.4 \times 100 - 90)}{1.10^{2}} \end{aligned}\] \[\begin{aligned} \text{Loan Interest} &= 7.5\% \end{aligned}\]If a default occurs, the bank will recover 40 and also a tax recovery of 20% of 60.
I believe there is a typo in the book. The Loan Interest should be 7.5% instead of 11.1%.
Loan Provision
Every year, the bank will hold part of its profit ito a loan loss provision for the next year. The amount is based on the “Expected Loss” on the loan portfolio. The calculation depends on the default probability and recovery rate.
Using the same example in Loan Valuation, we first calculate the Net Loan Value. We will use the loan rate of 11.1%:
\[\begin{aligned} \text{Net Loan Value} &= \frac{0.95 \times \Big(100 + 11.1)\times 0.8\Big) + 0.05 \times \Big(40 + (0.2 \times 60))}{1.10} - \frac{90 \times 0.05 \times 0.8 + 90}{1.10}\\ &= 9.305\\[5pt] \text{Interest Margin After Tax} &= 0.8 \times (0.111 \times 100 - 0.05 \times 90)\\ &= 5.28\\[5pt] \text{Attributable Profit} &= \text{Post-Tax Interest Margin} - \text{Fall in Loan Value}\\ &= 5.28 - (10 - 9.306)\\ &= 5.28 - 0.695\\ &= 4.585 \end{aligned}\]At the inception of the loan, the value is \(100 - 90 = 10\). The loan has fallen in value by 0.695. So the amount to keep as provision is the interest income not assigned to attributable profit:
\[\begin{aligned} \text{Provision Amt} &= \text{Net Interest Income} - \text{Attributable Profit}\\ &= 11.1 - 4.585\\ &= 6.515 \end{aligned}\]Product Lines
Interest-Bearing and Non-Interest-Bearing Current Accounts
These are checking accounts. Generally no interestor interest only on surplus balances. Not good from a liquidity perspective.
Demand Deposits
Always interest bearing and available for demand but cannot be used for checks or similar payments.
Time Deposits
Interest-bearing deposit with fixed maturity. Ranging from one month to 5Y.
Certificates of Deposit
CDs are like time deposits but able to be traded in secondary market. SO the yield will naturally be lower. Most CDs are between 1M and 3M and up to 5Y.
The largest holders of CDs are banks, money market funds, and corporations.
Commerical Paper
CPs are short-term money market dbt issued by banks and corporations. Usually in bearer form but could be registered.
Asset-Backed Commerical Paper
Short-term money market debts backed by cash flows from other assets. Normally these assets are transferred to a SPV.
The types of assets are:
- Equipment Lease Receivables
- Credit Card Receivables
- Auto Loans
- Coporate Loans
- Mortage Loans
- Real Estate Leases
Foreign Exchange
Trade FX with banks.
Government Bonds
Secondary market in government bonds is provided by banks.
Floating Rate Notes (FRNs)
Bonds with variable rates of interest that is quoted as a fixed spread over a reference rate. Additional features such as floors, caps, and callability are added to FRNs.
Repos
A secured loan with collateral posted.
Letter of Credit
The bank provide the service of guaranting payment from a buyer. Mostly used in international trade transactions.
Structured Deposits
The payoff is structured to match a particular customer’s specification.
Liquidity Facilities
A standing loan agreement where the borrower/client can draw down funds at anytime before the expiry of the agreement and up to a certain limit. The standing fee is paid even if funds are not withdrawn. It gives the borrower the options to borrow. A Revolving Credit Facility (RCF) is a commitment from a bank to lend on a revolving basis.
Syndicated Loans
Also known as leveraged loans. More than one banks will be involved. One of the banks will be the lead arranger. A loan agreement with terms such as loan size, interest rate, fees, covenants, and syndications (other banks) are documented.
The loans will also be divided into different seniority (tranches). It consists of a revolving credit facility (revolver) and term loans. Revolvers are often used to fund working capital requirements. The term loans are further divided into an amoritizing term loan (provided by banks), and institutational tranches provided by insitutional investors.
Leveraged loans mature between 7Y to 10Y but usually earlier due to prepayments.
Interest Margin Sensitivity Analysis
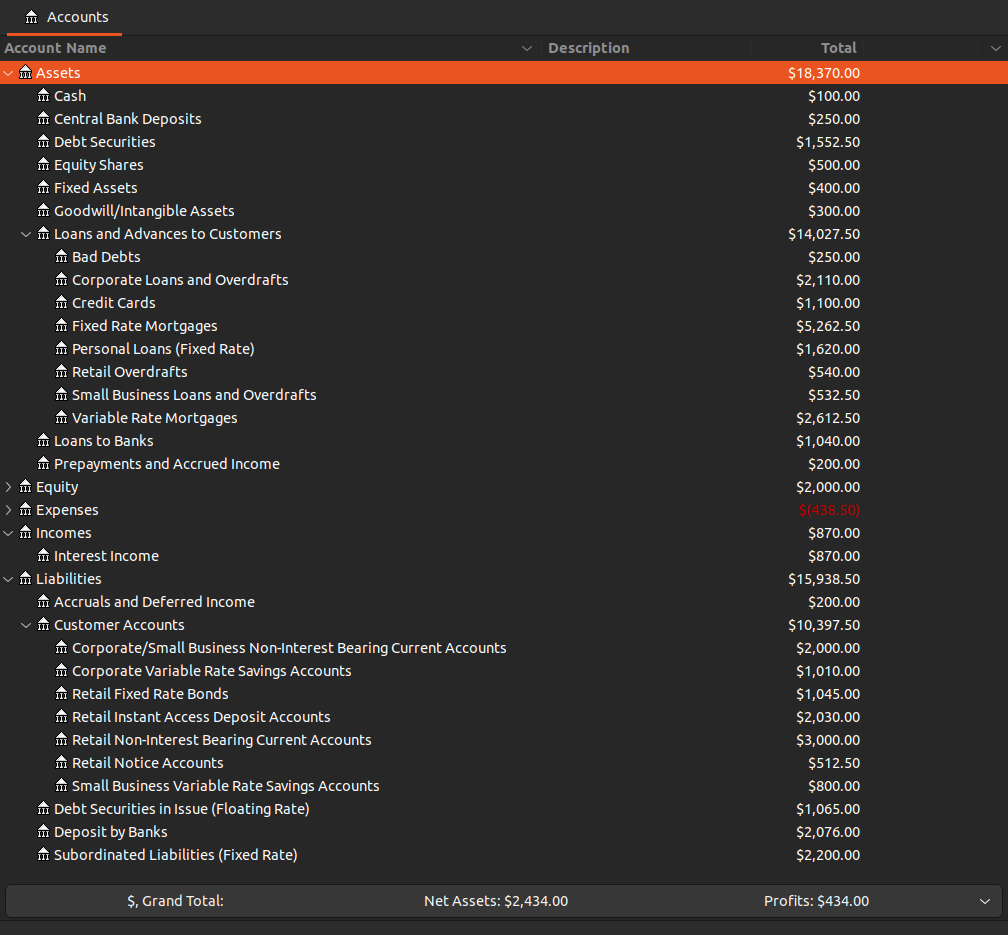
ChoudWest Bank is a hypothetical commerical bank in the book. The general interest rate is 5% and items on the balance sheets are assumed to remain constant for the next 12 months with now repayment or prepayments. This is the info in GNUCash:
The total interest earning assets (also including “Bad Debts Net of Provisions” which earn no interest but have the potential to earn interests) is 16,000.
\[\begin{aligned} \text{Net Interest Income} &= 972.5 - 511.5\\ &= 461.0\\[5pt] \text{Net Interest Margin} &= \frac{461}{\text{16,000}}\\ &= 2.88\% \end{aligned}\]Scenario 1: Interest Rates Rise by 3%
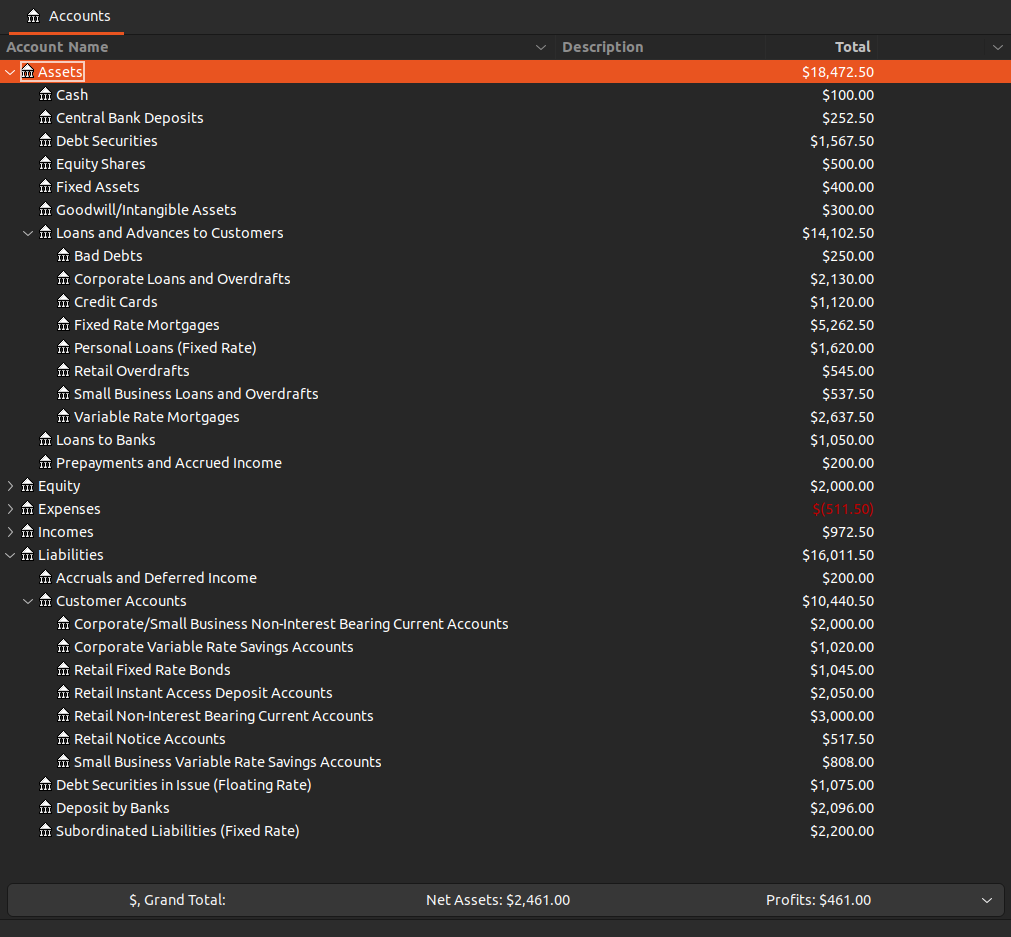
Fixed rate products will not be affected. Note that soe of the assets amounts differed from the base scenario. For example more funds are allocated to “Bad Debts Net of Provisions”.
We can see that when interest rates rised by 3%, both the NII and NIM increased.
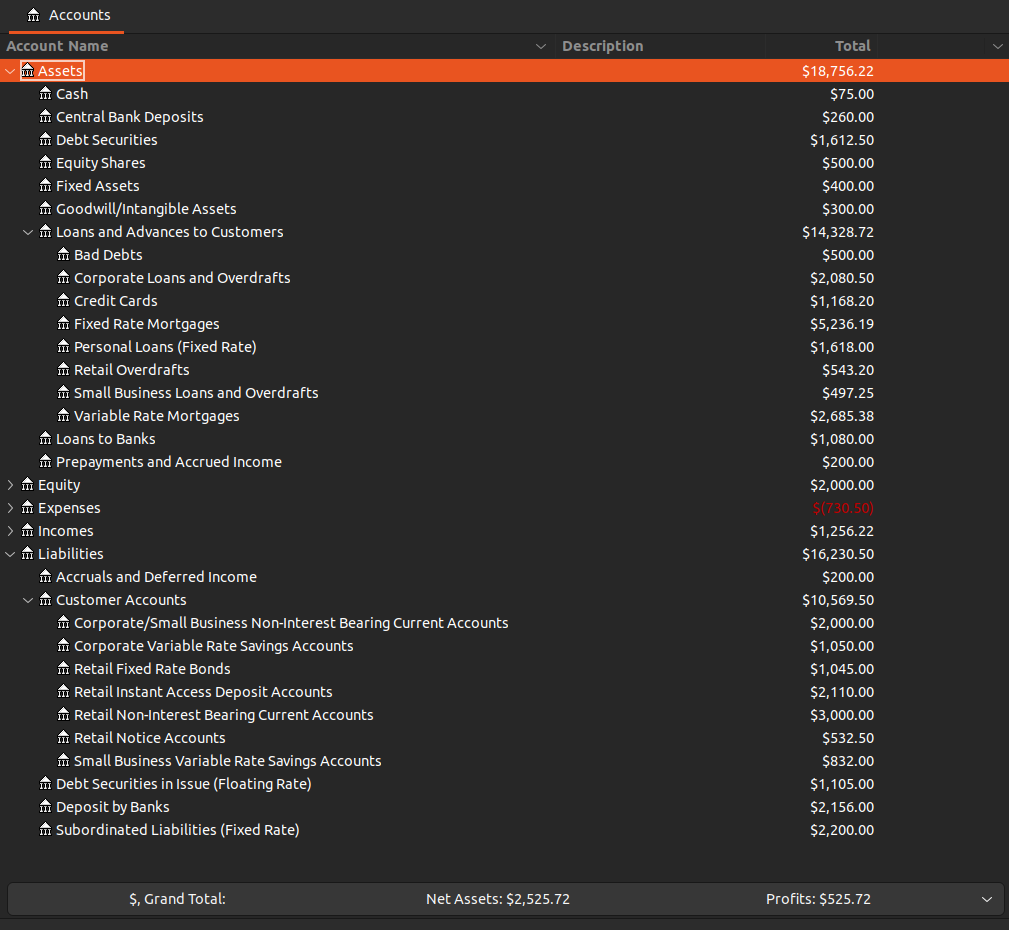
Scenario 2: Liquidity Buffer Strengthened
In scenario 2, ChodWest Ban invested an additional 1,500 in liquid debt securities to boost its liquidity buffer. These are funded by long-term variable-rate subordinated liabilities. Typically, a bank’s liquidity buffer is make up of government bonds and assets that have higher rating than the bank. This would result the funding cost to be higher than the yield on the liquidity buffer.
Note that the interest earning assets has gone up to 17,500 from 16,000. We have added 1,500 more in debt securities. Because funding cost is higher, the NII has gone down and furthermore the denominator went up as well causing NIM to fall down even more. But liquidity buffer is strengthened.
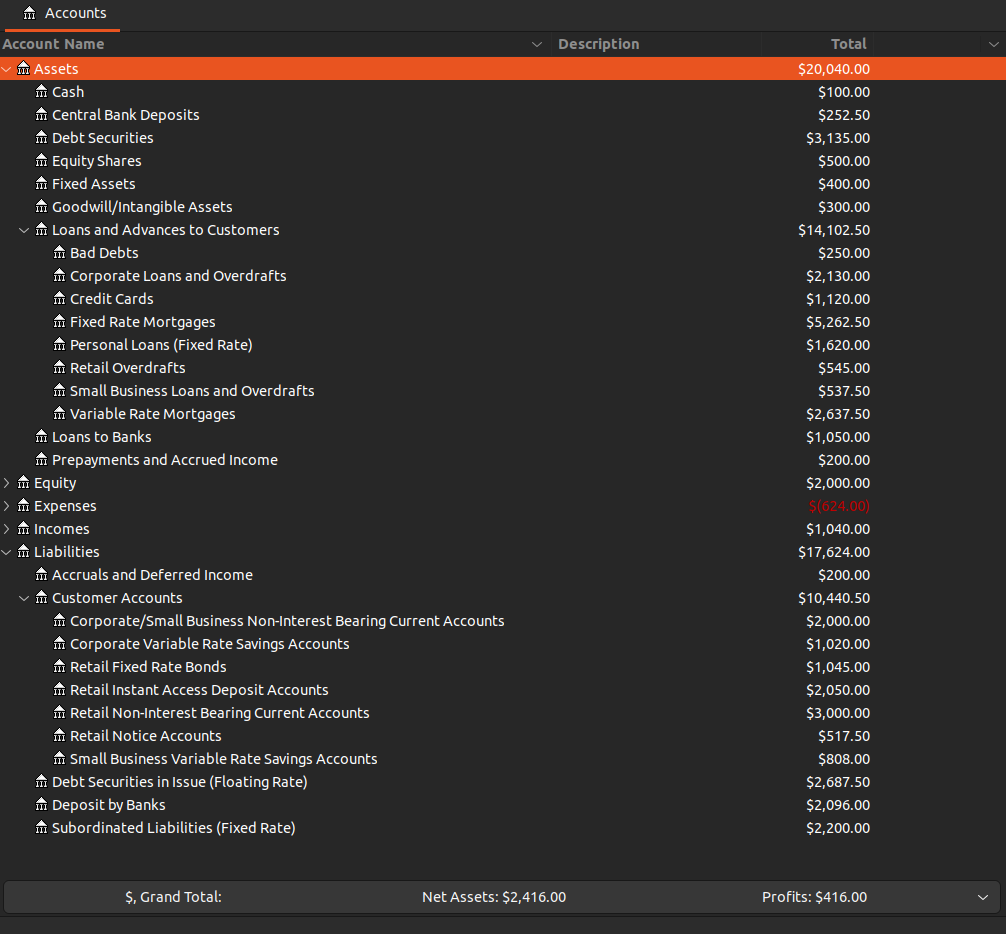
Scenario 3: Interest Rate Fall By 1%
Predictably, both NII and NIM fell. Interest expense fell by less than the fall of interest income.
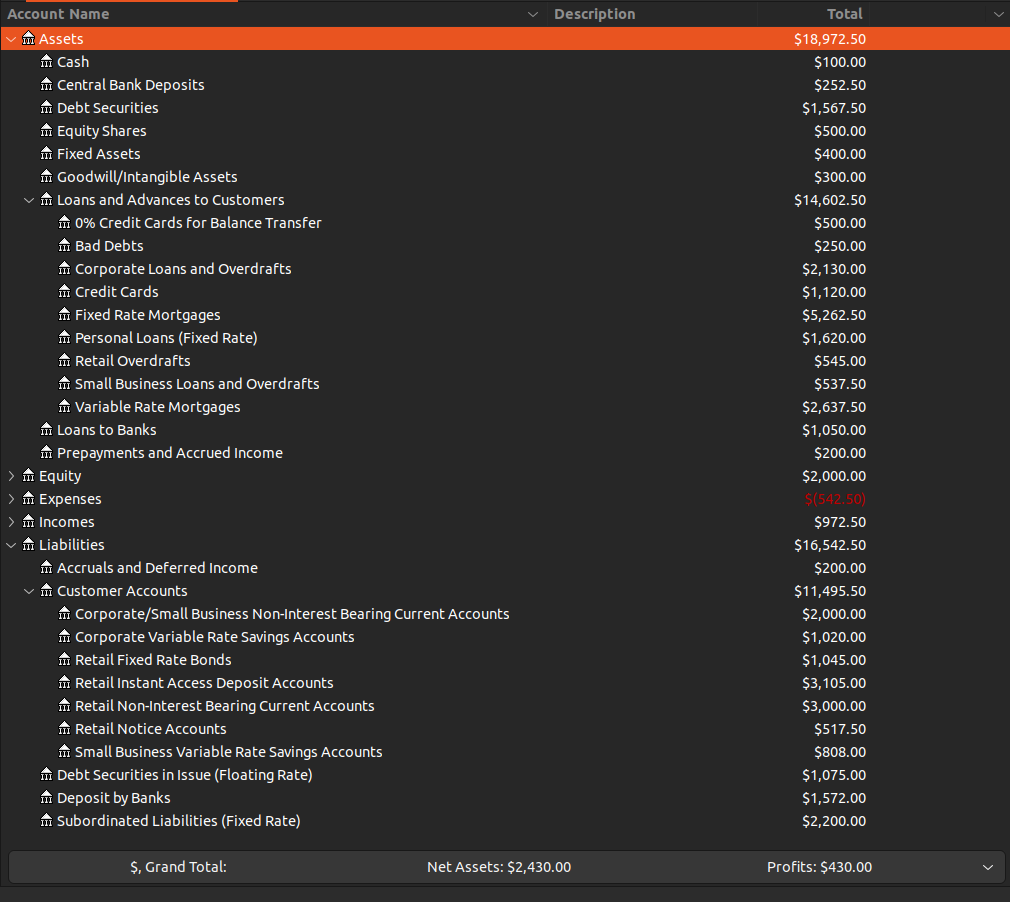
Scenario 4: Instant Access Deposit Account Re-launch
The bank launch a new 0% credit card (for balance transfer) to increase market share and relaunch an instant access deposit account increasing the interest rate from 2.5% to 3.5% and thereby increasing the account to from 2,000 to 3,000. Also Deposits of banks went down from 2,000 to 1,500. Earning assets has gone up by 500 from the 0% credit card launch.
Scenario 5: Mortgage Growth
ChoudBank increased its fixed and variable-rate mortgage products to boost market share. This is funded by a combination of new fixed rate retail deposits and short-term inter-bank deposits.
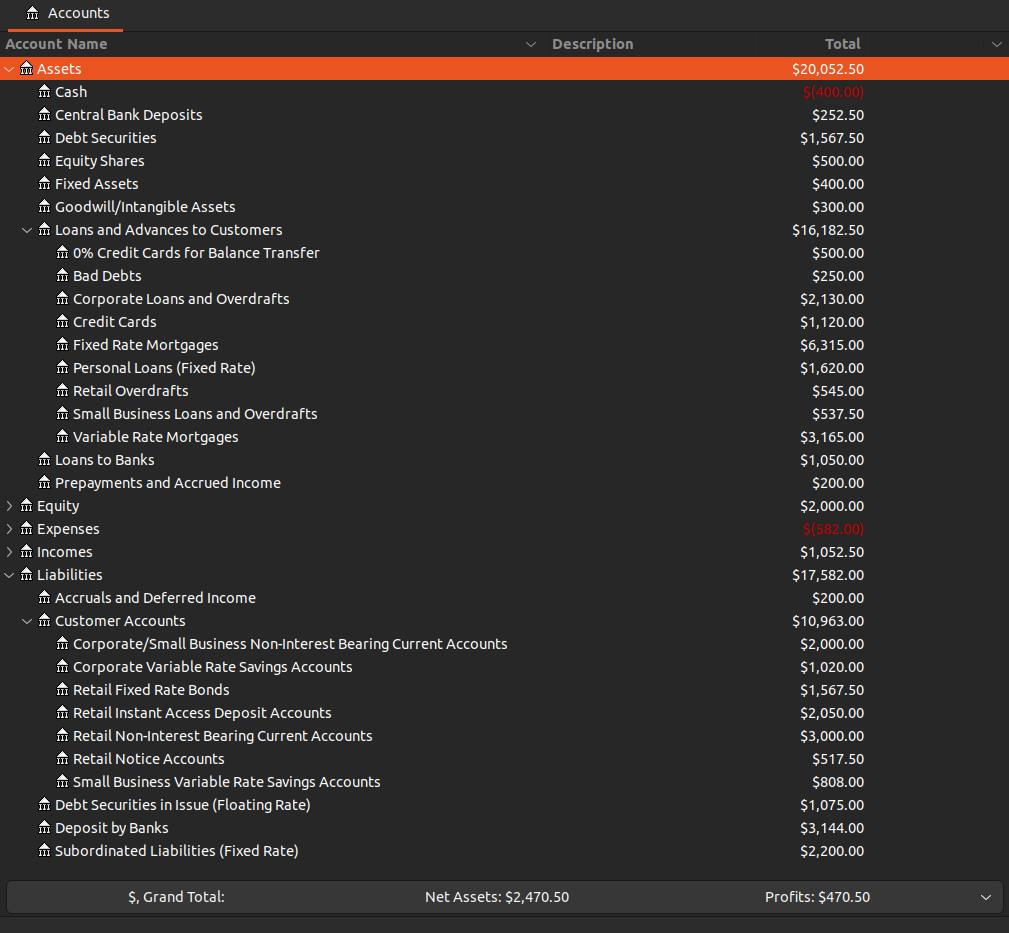
Due to the increase in Fixed/Variable Rate Mortgages, the earning assets has gone up to 17,500. The funding is from Deposits by Banks, and Retail Fixed Rate Bonds. As the funding cost is lower than the mortgage yields, NII went up but NIM went down from the increase in interest earning assets.
In summary, the interset rate sensitivity arises because of the mismatch in the deposit (short-term) and the loan (long-term) and they are not repriced at the same time.
