CPI Report
Read Post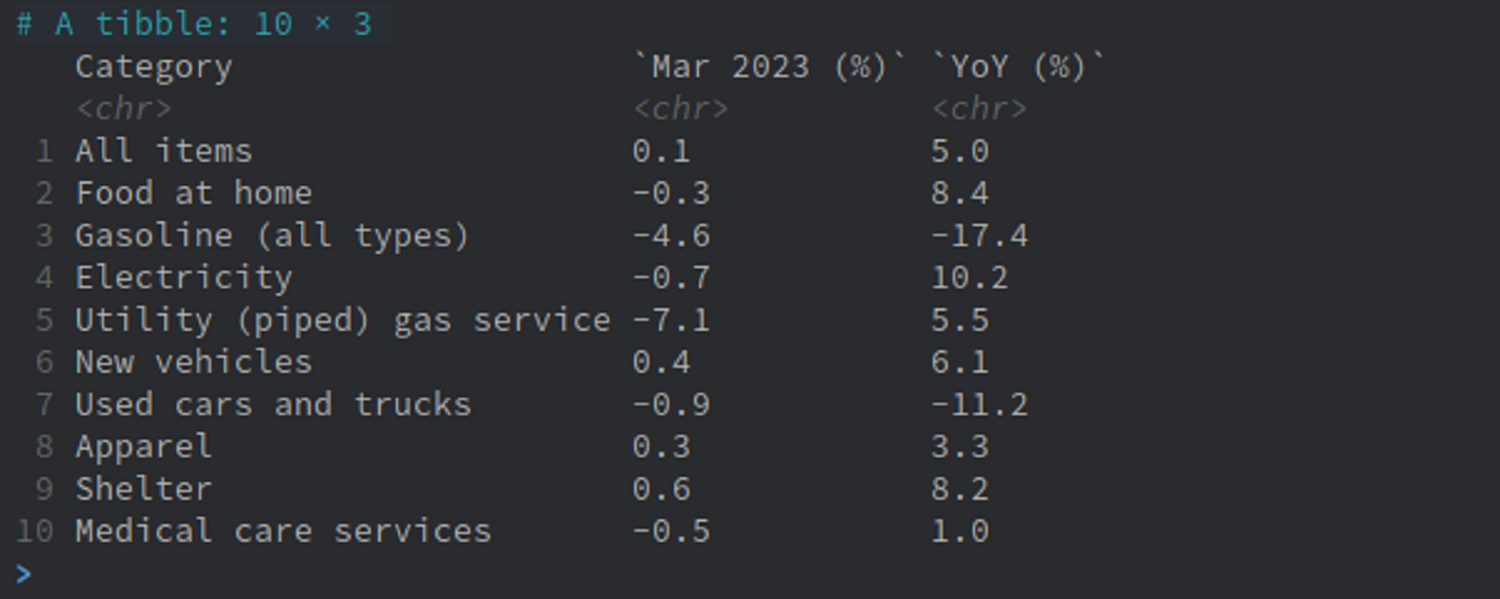
The CPI report is a monthly report prepared by the Bureau of Labor Statistics (BLS) that usually comes out on the second week (8th to 19th) of the month at 8:30am EST. There are no monthly revision and only annual changes in Feburary. In this post, we explain the key components of the report to look out for.
Contents:
Introduction
The Consumer Price Index (CPI) measures the change in prices for a basket of goods and services. The CPI is one of the multiple of ways to measure inflation. Other measures include the PCE, PPI, and GDP deflator. Inflation affects how much you pay for goods and services, business costs, Social Security benefits, etc.
An index year (1982-1984) is chosen for the CPI. For example a CPI index of 202 at the end of the year with 200 at the beginning of the year indicates an increase of 1% over the year. So the important measure is not the absolute value of the index but how the index changes over time.
CPI is considered a lagging indicator when predicting recession. Inflation will start to ease well after a recession, and start to increase well after a recovery.
Components of CPI
The CPI is computed as the weighted average of a basket of goods and services. The following are 8 groups with their corresponding weights:
| Group | Weight |
|---|---|
| Housing | 41% |
| Food and Beverages | 15% |
| Transportation | 17% |
| Medical Care | 7% |
| Apparel | 4% |
| Recreation | 6% |
| Education and Communication | 7% |
| Other Goods and Services | 3% |
As you can see, the biggest component of the CPI is housing.
Core CPI
Because food prices are seasonal and energy prices are both seasonal and prone to geopolitical reason. Energy and food prices are also sensitive to extreme weather changes. Core CPI is less noisy and show the underlying trend better. In the long term, both core CPI and CPI high correlate with each other and move in the same direction.
Causes of Inflation
There are two popular views on the casue of inflation:
Monetarist View
That inflation is caused by too much growth in the money supply. If the rate of money supply growth outpace GDP growth, it would mean too much money chasing over too little products/services and result in inflation.
Keynesian View
That inflation is caused by too much demand for goods and services. When the economy is not able to produce enough supply for the excessive demand, the resulting supply shortage will cause inflation.
How is CPI Computed?
The CPI index are based on prices of food, clothing, shelter, fuels, transpotation, doctor/dentist services, drugs, and other goods and services. In the first 3 weeks of the month, BLS representatives would collect data from stores and phone interviews with about 22k retail and other businesses, and about 6k households. Prices are collected from 80k different items and services.
The weights used in the calculation of the index are dependent on the population group. Local data are then combined to obtain an average for the particular US city. CPI-U and CPI-W have separate indexes that are published by city or region of the country.
The data collected is not just the sticker price. Considerations are also given to the changes in the product that is due to technological advancement or changes in the quantity. For example, if the bag of chips contain lesser chips and prices stay the same, BLS would consider that an inflation because you are getting less chips for the same price. Similarly, if there is an increase in quantity of a detergent given the same price, the price would be considered to decrease. Likewise, if a product gets more expensive but last longer due to technological advancement, depending on the situation, it might consider a price deflation rather than inflation.
Housing, which is the largest component of CPI, is computed based on rents and not the asset price. BLS divides rents into two categories:
- Residential rent
- Owner’s eqiuvalent of residential rent
Season Adjustment
When reporting the monthly CPI changes, the values are seasonally adjusted. The seasonal factors are calcuted by the X-13ARIMA-SEATS seasonal adjustment method. Basically the method finds common changes in the same period of the year for the past few years that could be resulted from weather events, production cycles, holidays, etc. This allows the detection of CPI changes that are not typical for the time of the year.
Seasonally adjusted data are subjected to revision for up to 5 years after their original release. Every year, new seasonal factors are calculated by economist and reapplied to the previous 5 years. Data beyond the previous 5 years are final and not readjusted.
Intervention Analysis
Certain extreme one time events need to be removed when calculating the season adjustment. If not, the extreme values will mask the other seasonal factors and would be inaccurate. For example fuel prices recover in 2009 from the economic dowturn of 2008. As this is a one time event, it was removed using the intervention analysis seasonal adjustment (IASA) method before applying X-13ARIMA-SEATS.
Sampling Error in the CPI
BLS provides the variance estimates for the CPI changes. Using the estimated standard error, we can come to a 95% confidence interval for the CPI change. For example, for a 1-month change of 0.2% in all items CPI-U, and a standard error of 0.06%, the 95% confidence interval (if we do the sampling many times, 95% of the time, the true value will lie in the confidence interval):
\[\begin{aligned} 0.2 \% \pm 0.06 \% &= -0.14\% \text{, } 0.26 \% \end{aligned}\]CPI-W vs CPI-U
BLS further divide CPI into two groups when reporting. One group consists of wage earners and clerical workers (The Consumer Price Index for Urban Wage Earners and Clearical Workers). It covers about 30% of the working population. It is used mostly for adjusting Social Security checks and collective bargaining agreements. The requirement to be counted under CPI-U is that more than half of the houehold’s income must come from wages, and at least one of the household must be employed at least 37 weeks during the previous year.
CPI-U is the broader measure which consists of all urban (nonfarm) workers (The Consumer Price Index for all Urban Consumers). It covers more than 90% of the consumers.
Note that the CPI-U and CPI-W are not seasonally adjusted.
Scrap Data
url <- "https://www.bls.gov/news.release/cpi.nr0.htm"
page <- read_html(
  paste0(url)
)

dat <- page |>
  html_nodes("#cpi_pressa") |>
  html_table() |>
  nth(1)

names(dat)[1] <- "Category"
cols <- c(
  "All items",
  "Food at home",
  "Food away from home",
  "Gasoline (all types)",
  "Fuel oil",
  "Electricity",
  "Utility (piped) gas service",
  "New vehicles",
  "Used cars and trucks",
  "Apparel",
  "Medicial care commodities",
  "Shelter",
  "Transportation",
  "Medical care services"
)

dat <- dat |>
  select(c(1, 8, 9)) |>
  filter(Category %in% cols)

names(dat)[2] <- "Mar 2023 (%)"
names(dat)[3] <- "YoY (%)"
See Also
References
The Trader’s Guide to Key Economic Indicators
