PPI Report
Read Post
The PPI report is a monthly report prepared by the Bureau of Labor Statistics (BLS) that usually comes out on the second week of the month at 8:30am EST. Each month report is only subjected to one revision 4 months later and an annual revision in Feburary. In this post, we explain the key components of the report to look out for.
Contents:
Introduction
Note that the PPI transitioned from the SOP (Stage-of-Processing) model to the FD-ID (Final Demand - Intermediate Demand)aggregation system in 2014. In this article we still talked about the SOP model which is essentially outdated. Will update in due course.
The PPI measures changes in prices at the manufacturers and wholesalers level, where they pay for goods at different stages of production. The increase in prices are likely to eventually pass down to consumers on the retail level.
Stages of Production
There are three progressive stages of production:
- Crude goods (Unprocessed Goods for Intermediate Demand)
- Intermediate goods
- Finished goods
Crude Goods
Crude goods are raw materials that enter the market for the first time. Examples include, corn, wheat, cattle, curde oil, timber, etc. They are susceptible to weather, diseases and political factors resulting in potential high price swings.
Intermediate Goods
Goods that have undergone process before reaching the final stage such as food ingredients, paper, auto parts, etc.
Finished Goods
This is the final stage before reaching the retailers (and what the retailers pay for aka wholesale price). This is the most closely watched measure out of the three stages.
Finished goods tend to move in tandem with CPI over the long term (6 to 9 months), but sometimes they diverge at a month-to-month basis. CPI consists of goods and services while PPI generally does not take into account of services.
Core-PPI is a subset of finished goods minus food and energy. Food and energy takes up about 40% of finished goods PPI and can tell you something about the future inflation rate.
How is PPI computed?
BLS will send out questionnaires on about 100,000 different items to around 30,000 firms around the country. The basket of goods consists of items representing all stages of production. The weights depend on how much sales revenue the goods will generate for the economy and revised every 5 years.
Note that imported goods, excise taxes, and most services are not counted in PPI. The 100 index baseline starts at 1982.
Scrap Data
url <- "https://www.bls.gov/news.release/ppi.nr0.htm"
page <- read_html(
  paste0(url)
)

dat <- page |>
  html_nodes("#ppi_nrtablea") |>
  html_table() |>
  nth(1)

dat <- dat[nrow(dat) - 1, c(1, 2, 3, 4, 7, 8, 10, 11)]

names(dat) <- c("Month", "Final Demand", "Final Demand (Less Food/Energy)",
"Final Demand Goods", "Final Demand Goods (Less Food/Energy)",
"Final Demand Services", "YoY", "YoY (Less Food/Energy)")

for (i in 2:ncol(dat)) { dat[1, i] <- paste0(dat[1, i], "%") }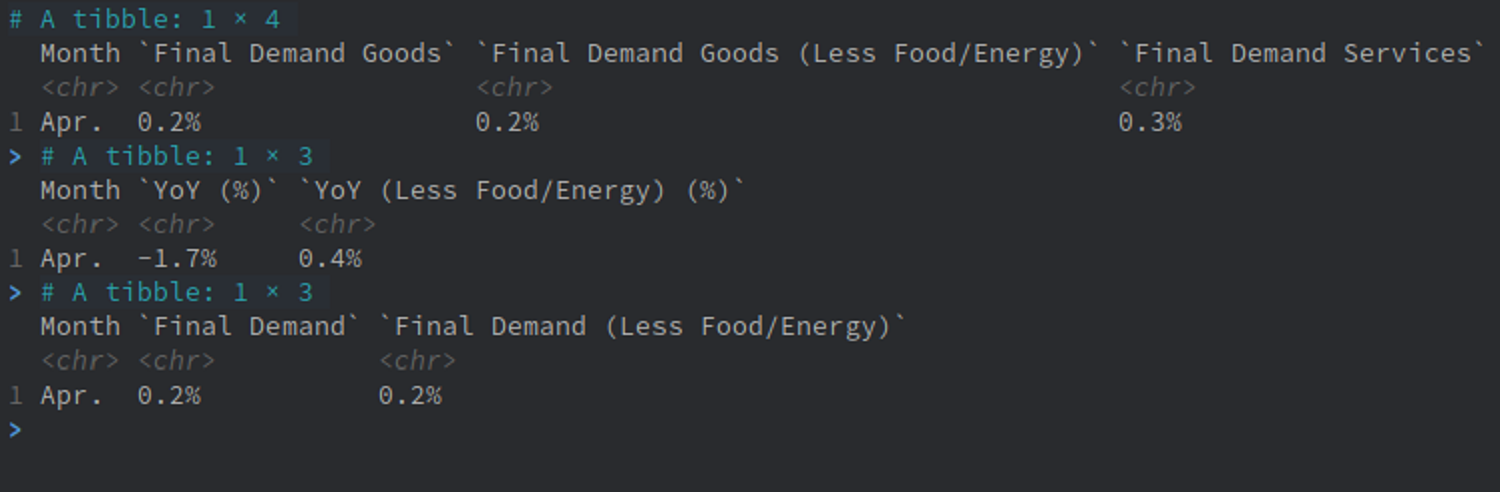
See Also
References
The Trader’s Guide to Key Economic Indicators
Secrets of Economic Indicators
