Gross Domestic Product (GDP)
Read Post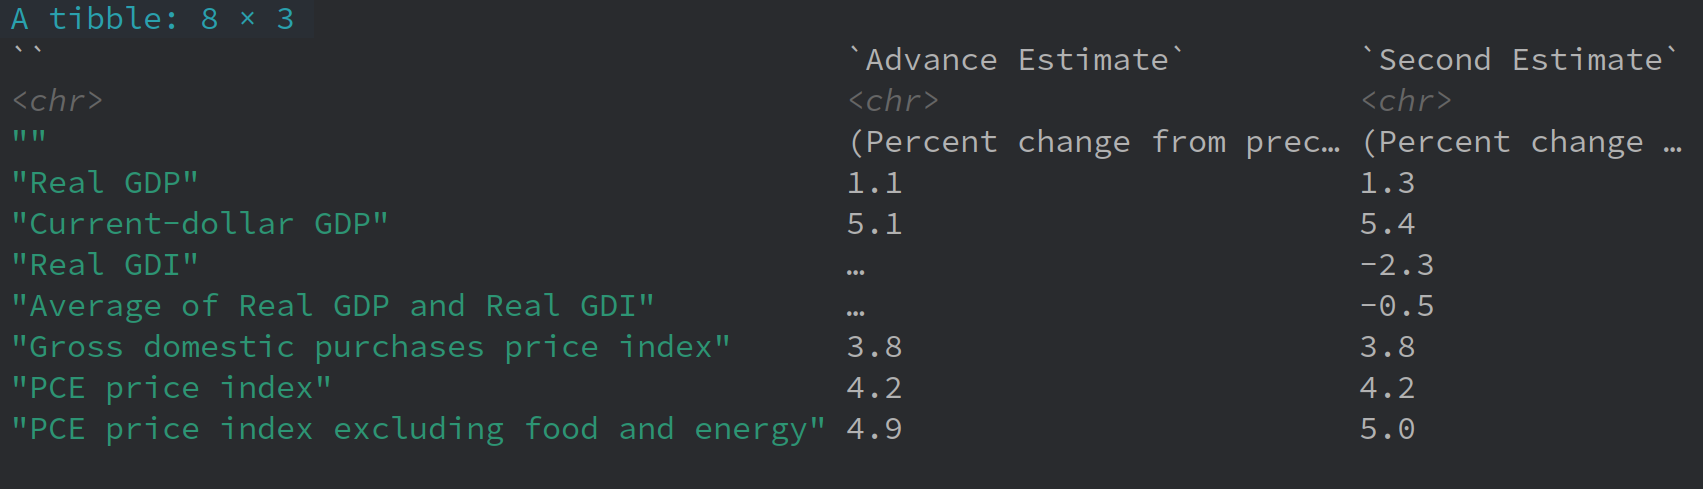
The Gross Domestic Product (GDP) report is a quarterly report prepared by The Bureau of Economic Analysis (BEA) that comes out on the final week of January, April, July, and October at 8:30am EST.
Contents:
Introduction
GDP is the sum of the final value (not double counting intermediate value) of all goods and services produced in the country for a specific period of time (a year). GDP is computed in nominal terms and real terms (minus inflation). GDP across time is only meaningful if inflation is stripped out. We are interested in the quantity of goods/services produced and not the increase due to price level.
GDP is complied as part of the National Income and Product Accounts (NIPAs) and known as “National Income Accounting”. There are 3 main revisions of GDP
Advance
Released on the last week of the 1st month after end of previous quarter
Preliminary
Released near the end of the 2nd month after the end of previous quarter
Final
Released near the end of the 3rd month after the end of the previous quarter
Components of GDP (Aggregate Expenditure Approach)
The Aggregate-Expenditure Approach focus on the buyer in an economy by adding all the expenditures of good and services.
The Aggregate-Expenditure Equation:
\[\begin{aligned} \text{GDP} = \text{C} + \text{I} + \text{G} + (\text{X} - \text{M}) \end{aligned}\]They are broken down into:
Personal Consumption Expenditures (PCE) (C) (70%)
Consumer spendings on goods and services. Divided into durable/nondurable goods, and services. Services make up the bulk of consumer spending (65%).
Gross Private Domestic Investment (I) (15%)
Business spendings and is divided into fixed investment and change in inventory investment.
Fixed investment covers nonresidential expenditures (offices, warehouses, etc) and residential expenditures.
Why we look at change in inventories and not just inventories is because the inventories could have been purchased in the previous year. So a change in inventory reflects only on expenditures for that year.
Government Consumption Expenditures and Gross Investment (G) (18%)
Government spendings is divided into federal (\(\frac{1}{3}\)), state, and local.
Net Exports (X - M) (13%)
Imports are deducted from exports because the goods/services are not produced in the country and represent output from another country.
National Income (Income Approach)
The other way to calculate GDP is the income approach. The sum of the incomes generated during the course of production is known as the “National Income”. They are composed of:
Compensation of Employees (65%)
Composed of wages and salaries (50%) and supplements (15%). Also includes commissions, and bonuses. BEA estimates this component by multiplying employment numbers from the Employment Situation report with the earnings and number of hours worked.
Examples of supplements are employer contributions for social and unemployment insurance.
Net Interest
These are net interest paid out by businesses through the course of operating the business. Interest on mortgages are counted as well because NIPA treat home owners as a business as well.
Proprietors’ Income
Earnings from non-corporation.
Rental Incomes
Rent income from residential and nonresidental property by owners not engaged in real estate business.
Corporate Profits
For corporations.
Inflation
The process of converting nominal and real GDP can be used to infer the inflation. There are three such inflation indicators:
GDP Implicit Price Deflator
The difference between nominal and real GDP is the implicit price deflator:
\[\begin{aligned} \text{Implicit Deflator} &= \frac{\text{Nominal Value}}{\text{Real Value}} \times 100\\ \text{Annualized Inflation} &= \Big(\frac{\text{Current Period Deflator}}{\text{Previous Period Deflator}}\Big)^{4} - 1 \end{aligned}\]Note that because GDP excludes imports, it does not show the full picture of inflation on the consumers.
Deflator for Gross Domestic Purchases
This deflator adds back the inflation from imports.
Deflator for Personal Consumption Expenditures (PCE)
The PCE deflator is a measure of inflation based off the PCE index. Based on the GDP definition of PCE, the PCE index is adjusted based on the GDP deflator.
Scrap Data
url <- "https://www.bea.gov/news/2023/gross-domestic-product-second-estimate-corporate-profits-preliminary-estimate-first"

page <- read_html(
  paste0(url)
)

page |>
  html_nodes(".table-responsive") |>
  html_table()

tq_get("GDP", from = start, to = end, get = "economic.data")

## Real GDP
tq_get("GDPC1", from = start, to = end, get = "economic.data")
GDP Now
The Atlanta Fed provides a running and more timely estimate of the real GDP growth based on available data for the current quarter called GDP Now. 13 subcomponents of GDP are forecasted based on statistical models (Bayesian Vector Autoregression (BVAR)) with recent data.
- Personal Consumption Expenditures: Goods
- Personal Consumption Expenditures: Services
- Real Private Nonresidential Investment: Equipment
- Real Private Nonresidential Investment: Intellectual
- Real Private Nonresidential Investment: Structures
- Real Private Residential Investment
- Real Exports of Goods
- Real Exports of Services
- Real Imports of Goods
- Real Imports of Services
- Real Federal Government Consumption & Gross Investment
- Real State & Local Govt Consumption & Gross Investment
- Real Change in Private Inventories divided by the one period lag of “Real Gross Domestic Product
The model forecast is updated 6 to 7 times a month depending on the following 7 data releases:
- Manufacturing ISM Report on Business
- U.S. International Trade in Goods and Services (FT900)
- Wholesale Trade, Monthly Retail Trade Report
- New Residential Construction
- Advance Report on Durable Goods Manufacturers
- Personal Income and Outlays.
Theoretically, as more data comes in, the forecast will be more accurate and converge to the GDP numbers given by BEA but without the lag.
PCE vs CPI
Coverage
PCE covers a wider range of goods and services including expenses on healghcare, housing, etc. CPI includes a fixed basket of goods and services by urban households.
Data Source
PCE is derived from NIPA while CPI is based on surveys by BLS.
Calculation Method
PCE adjusts for subsitution between goods and services and also changes in quality using a formula called the “Fisher Ideal Index”. CPI uses a fixed-weight index and does not account for subsitution effects.
See Also
References
A Guide to Everyday Economic Statistics (Amazon)
Secrets of Economic Indicators
