Leading Economic Indicator
Read Post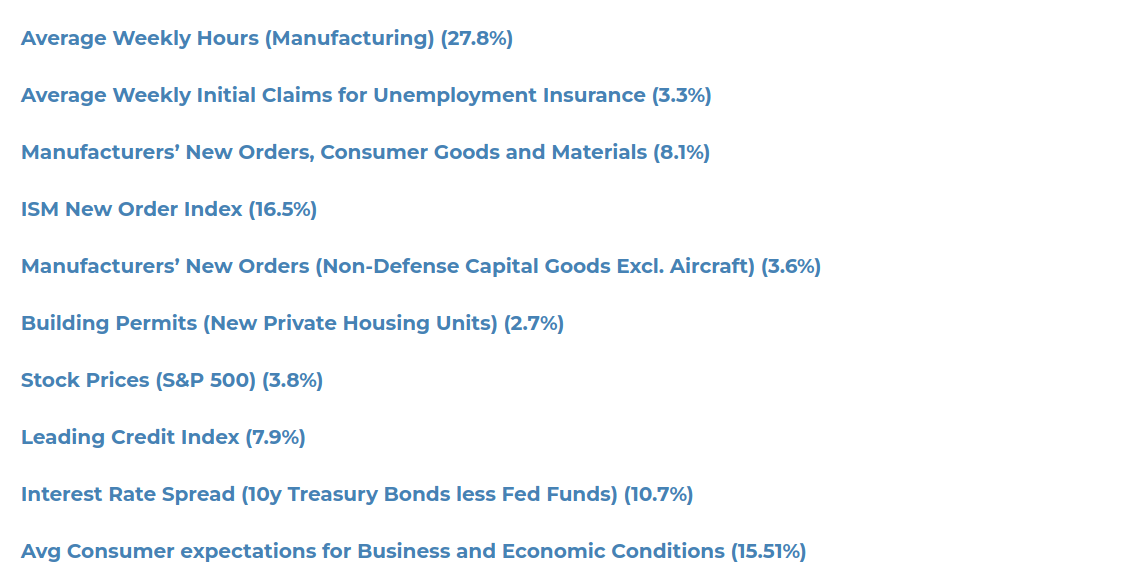
The LEI (Leading Economic Indicator) report is a monthly report prepared by The Conference Board that comes out on the third week of the month at 10:00am EST.
Components
The Leading Economic Indicator is comprised of the composite average of the following economic indicators:
Average Weekly Hours (Manufacturing) (27.8%)
Taken from the Employment Situation report.
Average Weekly Initial Claims for Unemployment Insurance (3.3%)
Taken from the Jobless Claims report.
Manufacturers’ New Orders, Consumer Goods and Materials (8.1%)
Taken from the Factory Orders report.
ISM New Order Index (16.5%)
Taken from the Supply Management’s manufacturing survey.
Manufacturers’ New Orders (Non-Defense Capital Goods Excl. Aircraft) (3.6%)
Taken from the Factory Orders report.
Building Permits (New Private Housing Units) (2.7%)
Taken from Housing Starts report.
Stock Prices (S&P 500) (3.8%)
S&P Index price.
Leading Credit Index (7.9%)
This index consists of 6 financial indicators:
- 2y Swap Spread (real time)
- LIBOR 3M less Treasuy-Bill Yield spread (real time)
- Debit balances at margin account at broker dealer (monthly)
- AAll Investors Sentiment Bullish (%) less Bearish (%) (weekly)
- Senior Loan Officers C&I Loan Survey (SLOOS) (quarterly)
- Security Repurchases from the Total Finance-Liabilities section of Fed Flow of Funds Report (quarterly)
Interest Rate Spread (10y Treasury Bonds less Fed Funds) (10.7%)
Taken from market.
Avg Consumer expectations for Business and Economic Conditions (15.51%)
Taken from two surveys. “Consumer Expectations for Economic Conditions 12-months ahead” from “Surveys of Consumers” by University of Michigan. “Consumer Expectations for Business Conditions 6-months ahead” from “Consumer Confidence Survey by The Conference Board”.
Missing and Data Lag
If the data is not available at the time of publication, estimates are imputed from past data via autoregressive model. Revisions (up to six months) are available in the next month’s release when new and more accurate data are available.
Interpretation
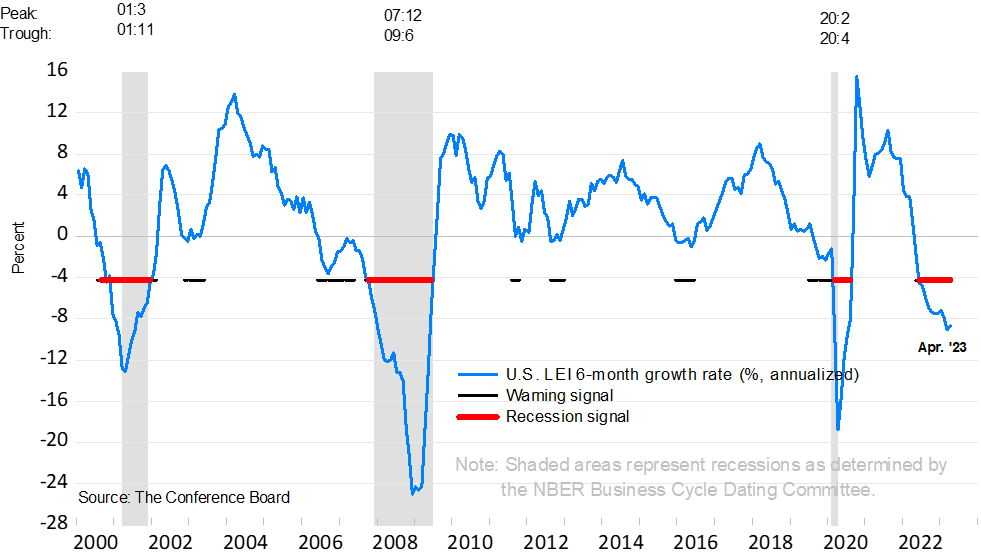
LEI is supposed to signal the turning point of the economy and where the economy is heading. Previously, the interpretation was 3 consecutive months of decline signal a recession in 3 to 9-months time. And 3 consecutive months of increases signal the end of a recession.
However, due to a number of false signals, The Conference Board has changed to looking at the 3D’s rule. Duration, Depth, and Diffusion. Duration and depth are measured by the rate of change of the index over the last 6-months. Diffusion is a measure of how widespread the decline is. The diffusion index ranges from 0 to 100. A level below 50 indicates the components are weakening.
As the individual components have their own release date, the LEI can be anticipated before the actual release of the report rendering it not as timely.
Image taken from The Conference Board:
Scrap Data
url <- "https://www.conference-board.org/topics/us-leading-indicators"

page <- read_html(
  paste0(url)
)

img_element <- page |>
  html_nodes("p > .img-responsive")

mybase64 <- img_element |>
  html_attr("src")

raw <- base64enc::base64decode(what = substr(mybase64, 23, nchar(mybase64)))
png::writePNG(png::readPNG(raw), "~/Downloads/lei.png")
See Also
References
A Guide to Everyday Economic Statistics (Amazon)
Secrets of Economic Indicators
